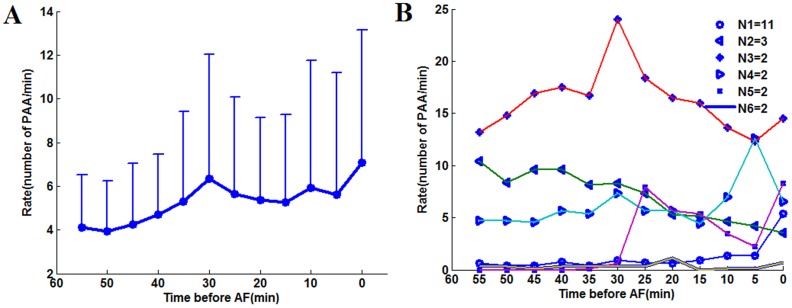
Figure 5. RPAA temporal evolution and the patterns of change.
(A) Mean value and standard deviation of PAA rate within each 5 minutes in the last hour before AF; (B) Mean patterns associated to the clusters obtained by the analysis of the five minutes time series. The number of patients corresponding to each pattern is indicated in the legend. Only the patterns with more than one patient are shown. The abscissa is the time before the onset of AF (minutes).

