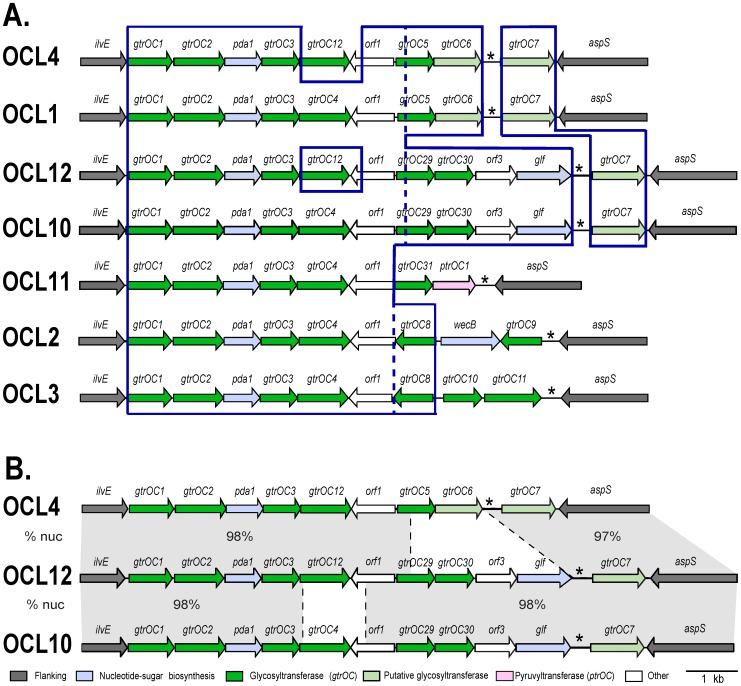
Figure 3. Group A OC locus arrangements.
A. Genes are shown as arrows indicating the direction of transcription. The colour scheme represents the predicted functional family of the gene products and is shown below. Assigned gene names are shown above as defined in Table 3. Shared regions are boxed. B. Comparison of OCL12, OCL4 and OCL10. Grey shading indicates shared regions, with the % nucleotide identity between pairs shown. Figures are drawn to scale from GenBank accession numbers JN968483 (OCL1), CP000521 (OCL2), CP001182 (OCL3), ASER01000014 (OCL4), AMHC01000037 (OCL10), ASFV01000000 (OCL11), and ATGJ01000006 (OCL12).

