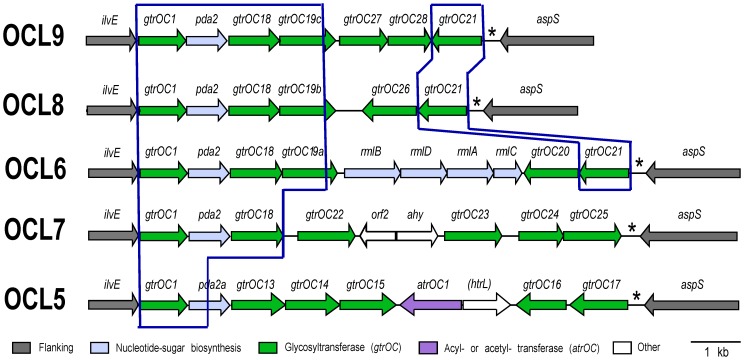
Figure 4. Group B OC locus arrangements.
Arrows represent genes showing direction of transcription. Gene annotations are shown above, as defined in Table 3. Modules shared between arrangements are boxed. Colour scheme key is below, and the figure is drawn to scale from GenBank accession numbers HM590877 (OCL5), AMFS01000036 (OCL6), AMTB01000027 (OCL7), ABXK01000027 (OCL8), and ALOH01000183 (OCL9).

