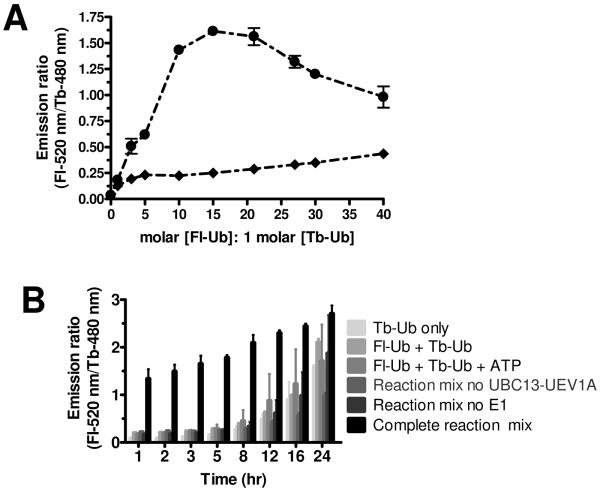
Figure 3. Assay optimization.
(A) Determination of optimal Fl-Ub: Tb-Ub ratio. The acceptor fluorophore, FI-Ub, was titrated against donor Tb-Ub to determine ratio for optimal signal:noise (S/N) results in the UBC13-UEV1A-mediated TR-FRET reaction. Complete ubiquitination reaction mixtures (- • -) consisting of E1 (12.5 nM), UBC13-UEV1A complex (500 nM), Tb-Ub (10 nM), and Mg2+/ATP were incubated with increasing molar ratio of FI-Ub: Tb-Ub, ranging from 0–40. Ubiquitination reaction mixtures lacking UBC13-UEV1A complex (- ◆ -) were similarly incubated with increasing molar concentrations of FI-Ub. Graphical analysis of TR-FRET measurements shows S/N > 6.0 with 15: 1 molar ratio of [FI-Ub]: [Tb-Ub]. TR-FRET data were plotted as emission ratio (y-axis) versus molar ratio of [Fl-Ub]: [Tb-Ub] (x-axis). Data are represented as mean ± SEM (n=2) and represent 1 hr measurements. Note that because the total amount of ubiquitin also changed, the optimal Fl-Ub:Tb-Ub ratio may be different as total ubiquitin varies. (B)Effects of temperature and time on TR-FRET-based ubiquitination assay using UBC13-UEV1A. Time-dependent ubiquitination reactions were performed at RT. Reaction components are indicated. Data are represented as mean ± SEM (n=3). Note that signal:noise ratio remains acceptable for ~8 hr at RT but not at 37 °C.

