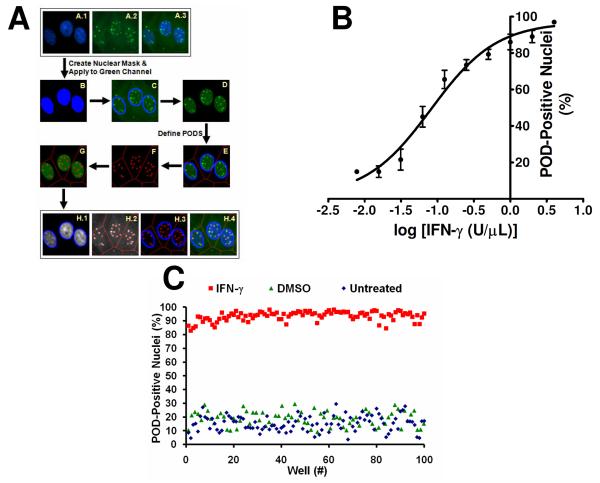
Figure 2. High Content Screen (HCS) Development and Optimization.
(A) Algorithm for detecting and quantifying PODs. DAPI (A.1; blue), PML (A.2; green), and merged (A.3) images of IFN-γ-treated (4 U/μL; 12 h) HeLa cells are shown. The nuclear (DAPI) image was used to produce a nuclear mask (B; blue). The nuclear mask (C; blue outline) was applied to the PML image. Green pixels outside of the nuclear mask were eliminated (D). Beckman Coulter CytoShop software was used to estimate cellular area (E; red outline) based on the nuclei. POD outlines (F; red) were identified based on differences in green pixel brightness. The number of detected PODs (G; red) was reported on a per-nucleus basis. The percentage of POD-positive nuclei (>4.0 PODs per cell) was reported. (B) Quantification of IFN-γ-induced POD formation. HeLa cells were seeded in a 384-well plate (3150 cells/well), and treated with increasing concentrations of IFN-γ (12 h) as shown. Cells were immunostained for PODs (mouse monoclonal anti-human PML and Alexa Fluor 488 chicken anti-mouse antibodies), incubated in DAPI (nuclear stain; 100 ng/mL), imaged using the Beckman Coulter Cell Lab IC-100 Image Cytometer (40× 0.6NA ELWD Plan Fluor objective), and quantified using the described computerized algorithm. Mean ± standard deviation are shown (n=4 wells/data point, >200 cells imaged and quantified per well). (C) POD HCS reproducibility assessment. HeLa cells were cultured overnight in a 384-well plate (3150 cells/well seeded using the Matrix WellMate bulk liquid dispenser), treated with IFN-γ (4 U/μL), DMSO (0.1%), or nothing for 12 h, immunostained for PML, imaged, and analyzed (n>85 wells/condition). The Z'-factor is 0.64 or 0.65 using DMSO or untreated cells, respectively, as the negative control.

