
Figure 3. High Content Screening (HCS) for Chemical Activators of PODs.
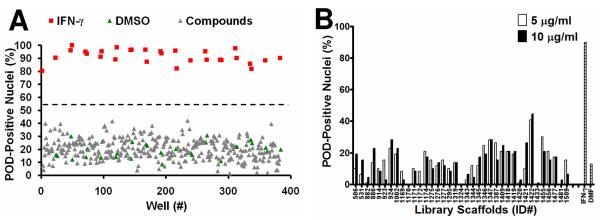

(A) Sample plate from the LOPAC1280 POD localization screen. HeLa cells were seeded in 384-well plates (3150 cells/well) and incubated at 37°C overnight. The cells were then treated for 12 h with IFN-γ (4 U/μL; positive control), DMSO (0.1%; negative control), or LOPAC1280 compounds (5 μM). Plates were immunostained for PML, imaged, and analyzed. The Z'-factor was 0.55. (The dotted line represents the mean value between the positive and negative controls). (B) TPIMS Combinatorial Library POD localization screen. Cells were screened as described previously, but with mixtures from the TPIMS scaffold ranking library (5 μg/mL or 10 μg/mL, representing ~10 μM or ~20 μM, respectively, for MW≈500 g/mol). IFN-γ (4 U/μL) was used as the positive control and DMF (0.1%) was used as the negative control. The Z'-factor was 0.6. (C–E) Combinatorial library deconvolution reveals SAR of N-methyl triamine compounds. Deconvolution of the mixture-based N-methyl triamine library was accomplished by the positional scanning method23–25,28 where one of the substituents used to create the library was fixed at positions R1 (C), R2 (D), or R3 (E), and the other positions were allowed to vary as mixtures of all possible substituents employed in library construction. Compounds were tested at 4 μg/mL (representing ~8 μM for MW≈500 g/mol). IFN-γ (4 U/μL) was used as the positive control and DMF (0.1%) was used as the negative control (striped bar). The Z'-factor was ~0.5.