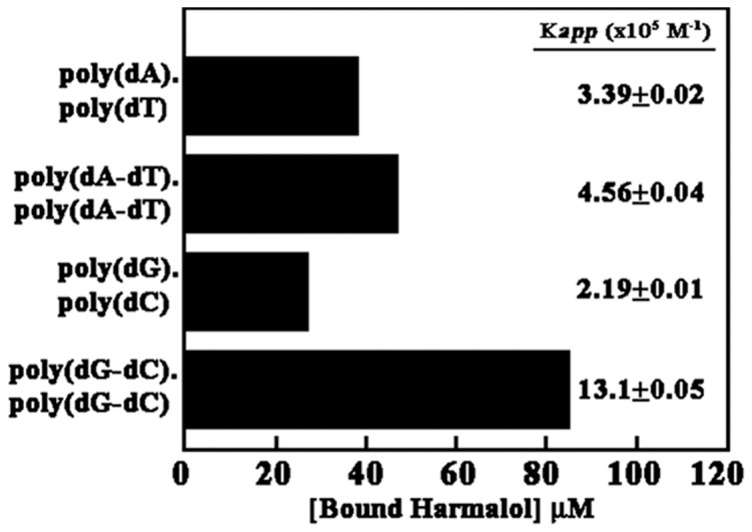
Figure 2. Results of competition dialysis experiment in 15 mM CP buffer, pH 6.8 at 25±0.5°C.

The concentration of harmalol bound to each polynucleotide sample is shown as a bar graph. The data given are average of three independent experiments under identical conditions.
