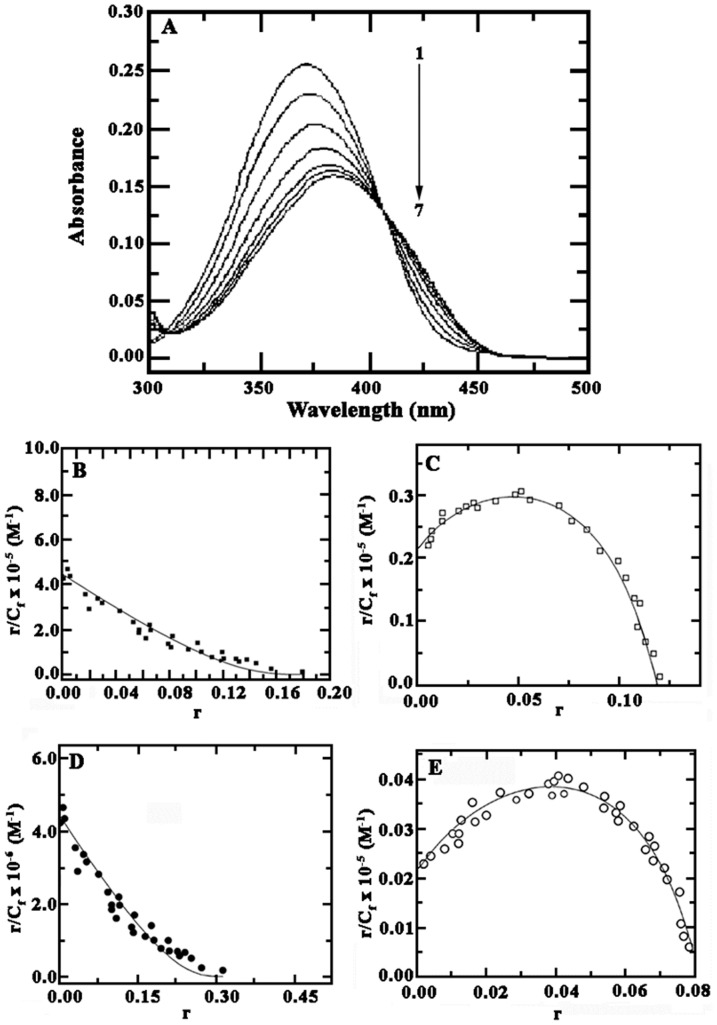
Figure 3.
(A) (Top panel) A representative figure showing the changes in the absorption spectra of harmalol upon titration with poly(dG-dC).poly(dG-dC) in 15 mM CP buffer, pH 6.8 at 25±0.5°C. Curve (1) denote absorption spectrum of harmalol (10.0 µM) treated with 5.16, 10.5, 20.2, 30.50, 35.0 and 50.0 µM (curves 2–7) of poly(dG-dC).poly(dG-dC), respectively. (Bottom panel) Scatchard plots derived from absorbance spectral data for the binding of harmalol to 20 µM of (B) hetero AT, (C) homo AT, (D) hetero GC and (E) homo GC polynucleotides. The data was fit to both cooperative and non cooperative binding model derived from McGhee-von Hippel equation [68]. The best fit values of Kb, n and ω are presented in Table 1.

