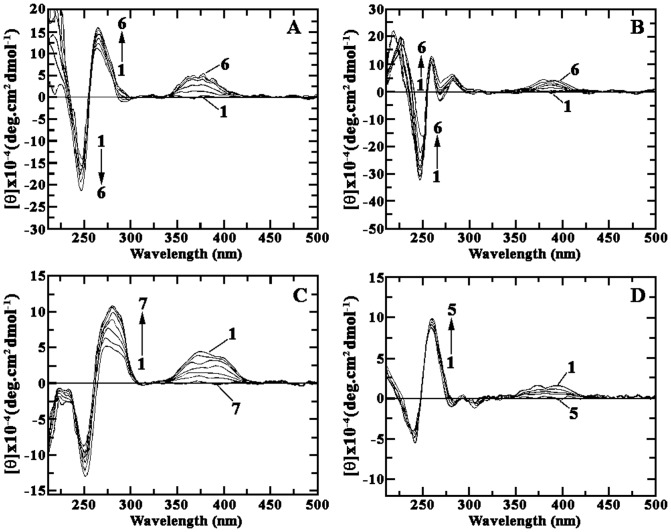
Figure 5. Representative CD spectra resulting from the interaction of harmalol, with the polynucleotides in 15 mM CP buffer of pH 6.8 at 25±0.5°C.
(A) Curves (1–6) denote poly(dA-dT).poly(dA-dT) (40 µM) treated with 0, 5.0, 12.0, 15.0, 25.0 and 35.3 µM of harmalol. (B) Curves (1–6) denote poly(dA).poly(dT) (42 µM,) treated with 0, 2.0, 8.0, 12.0, 25.0 and 40.3 µM of harmalol. (C) Curves (1–7) denote poly(dG-dC).poly(dG-dC) (40 µM,) treated with 0, 2.0, 4.0, 8.0, 15.0, 25.0 and 40.3 µM of harmalol. (D) Curves (1–5) denote poly(dG).poly(dC) (45 µM,) treated with 0, 5.0, 16.0, 34.0 and 45.0 µM of harmalol. The expressed molar ellipticity (θ) in each case is based on the polynucleotides concentration.

