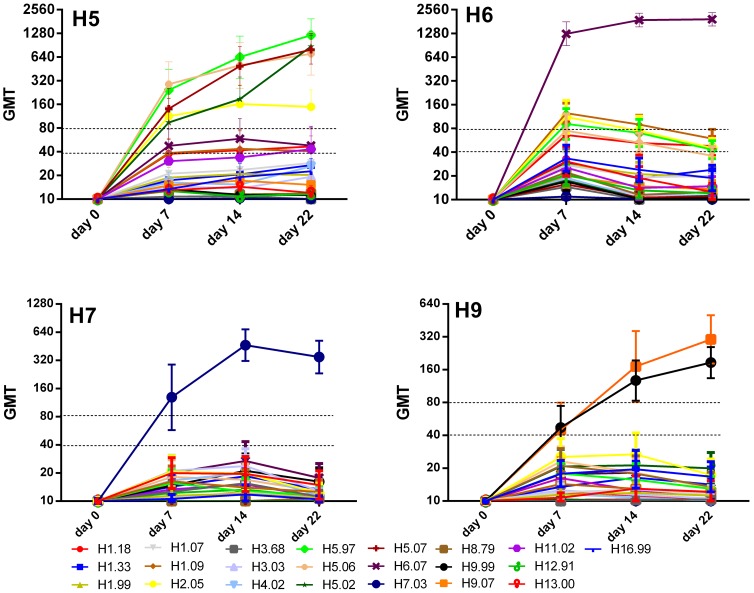
Figure 1. Kinetics of serological responses of SPF chickens after intratracheal infection with live virus (group 2).
Titles of each graph indicate infection group. X-axes depict the day of serum collection post infection. Y-axes indicate geometric mean titers (GMT). Error bars represent 95% confidence intervals of the measurements. Note differences in log-scale. Heterologous reactions above the dotted line represent cross-reactive responses with a titer higher than 1∶40 or 1∶80, respectively.

