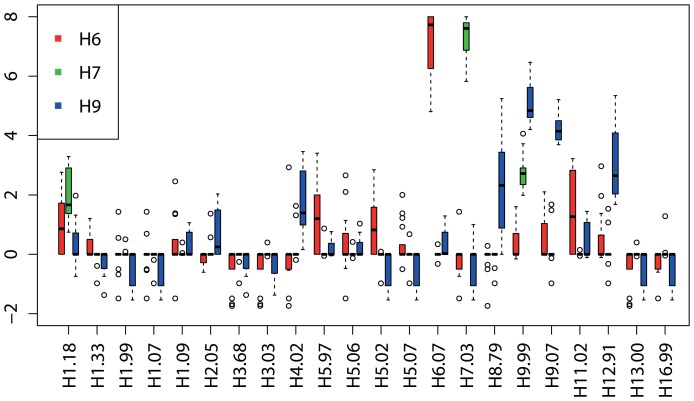
Figure 4. Antibody profiles of field chickens expressed as log2-transformed median antibody titer ratios plotted per outbreak.
Antibody titer ratios were derived by log transforming the data, calculating the median antibody reactivity across all antigens included on the PA and subtracting it from the antibody reactivity against individual antigens. This was calculated for every chicken. By doing that, every individual's values are normalized according to its own background reactivity. Individual ratios were summarized in boxplots. Horizontal bars within each box represent log2-transformed median antibody titer ratios per antigen and outbreak. Chickens naturally infected with H6 are depicted in red (n = 17), H7 in green (n = 10) and H9 in blue (n = 8). The two H6-outbreaks were combined in this analysis.

