
Figure 3. Amygdala-hippocampal network alterations with depressive symptoms.
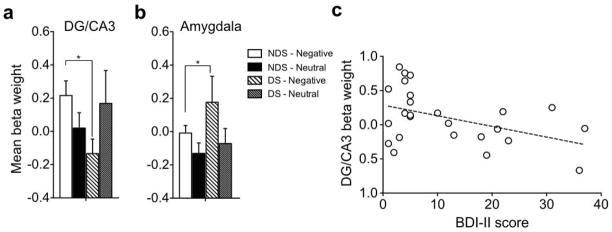
a) Mean activity beta weights during correct rejection of highly similar lures in hippocampal DG/CA3, which shows decreased DG/CA3 activity in DS compared to NDS during negative lures, b) Mean activity beta weights during correct rejection of highly similar lures in the amygdala, which shows increased activity in the DS group during negative lure CR’s, c) Negative correlation between depressive symptom severity and DG/CA3 beta weight during negative lure CR’s. Note that other significant comparisons (e.g. within NDS) are duplicated from Fig 2 and are not indicated here as significant. * indicates significance at p<.05, Error bars are ± S.E.M.