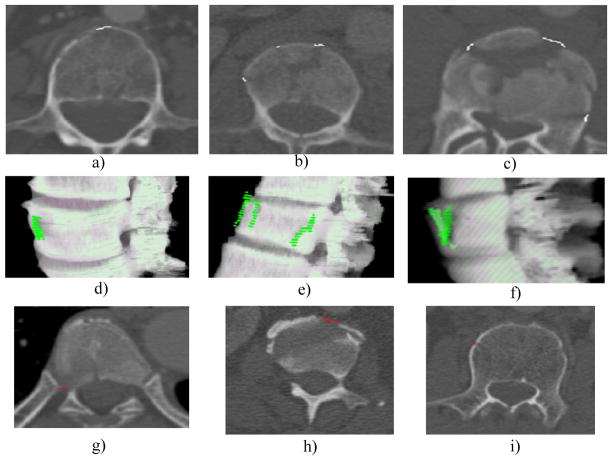
Figure 10. Detections in the fracture CAD.
a,b,c) true positive detections on 2D slice, white markers; d,e,f) same true positive detections on 3D surface, green markers; g) false positive, costovertebral junctions; h) false positive, partial volume averaging of vertebral disks; and i) false positive, nutrient vessel foramina.

