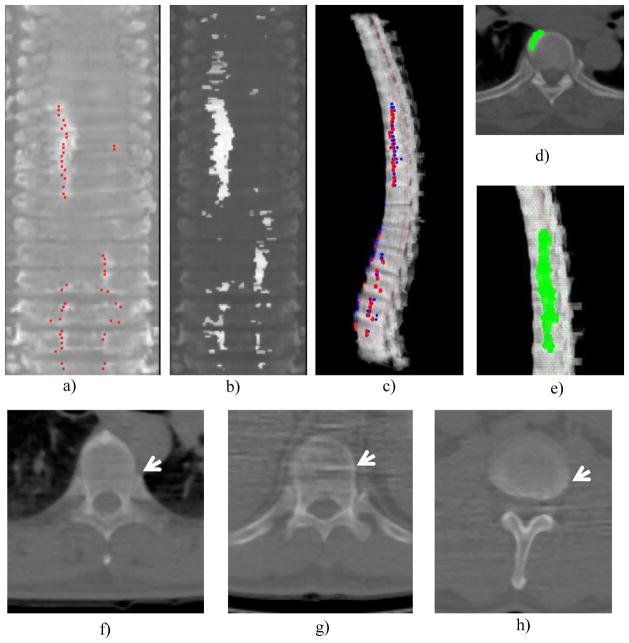
Figure 12. Detections in degenerative osteophyte CAD.
a) Reference standard projected onto the stacked feature map (red dots); b) detected osteophyte sites, highlighted horizontal segments; c) final detections projected back to 3D spine, red: reference standard, blue: detections; d) osteophyte detection on 2D slice; e) osteophyte detection on 3D display; f) false positive, costovertebral junction; g) false positive, image artifact and h) false positive, partial volume averaging of inter-vertebral disk.

