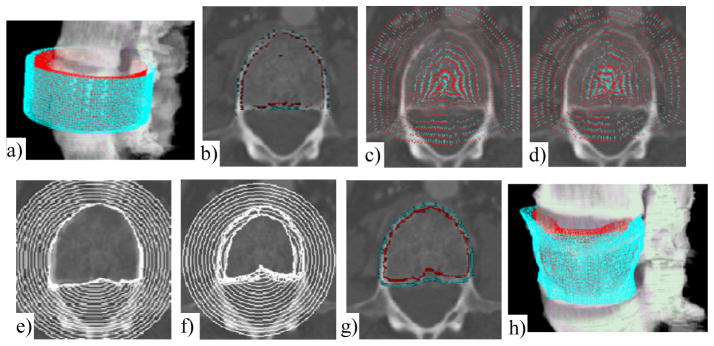
Figure 6.

Cortical shell segmentation
The original image is in Figure 2a. a) Initial models; b) Potential boundary map (RE, RI), cyan: RE, red: RI; c) Potential force for exterior surface P(SE); d) Potential force for interior surface P(SI). Maps are down-sampled for clarity. Force direction points from red to cyan; e) Evolution of exterior surface; f) Evolution of interior surface; g) Results of dual-surface segmentation; and h) 3D visualization
