
Fig. 4.
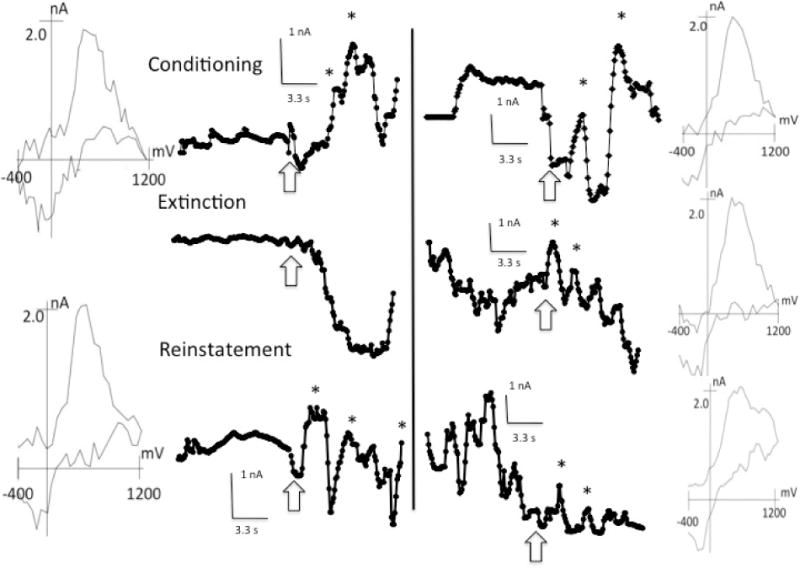
DA transients recorded during the 10 s CS and 10 s pre-CS periods during the acquisition, extinction, and reinstatement trials for Rats 4 and 2 in the left and right columns, respectively. DA transients, indicated by asterisks, were confirmed by corresponding background subtracted voltammograms shown in the left-most and right-most columns for Rats 4 and 2, respectively. Arrows indicate the onset of the 10 s tone period. Only first-peak voltammograms are presented.