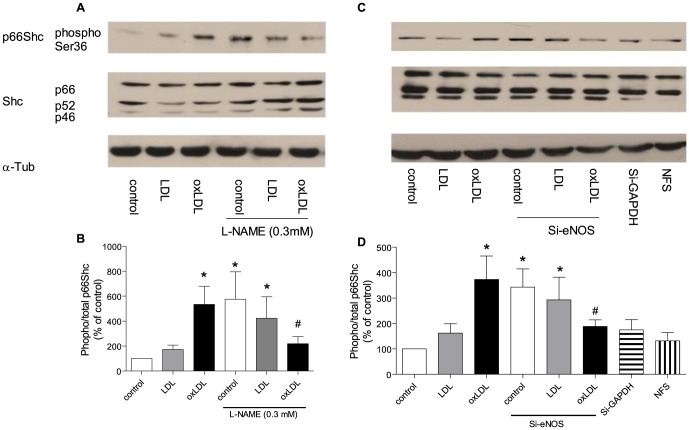
Figure 2. Representive Western blot (A, C) and densitometric quantification of phospho-p66Shc protein expression (B, D) in HAEC after twenty-four hours of incubation with oxLDL in the presence of nitric oxide synthase inhibitor (L-NAME 0.3 mM; A and B) and in the presence of eNOS siRNA (10 nM, C and D).
The phosphorylation of p66Shc was normalized to total p66Shc protein and total p66Shc was normalized to α-tubulin. Results are presented as means±SEM; n = 8. * p<0.05 vs. cells under control conditions. # p<0.05 vs. oxLDL alone. (NFS: nanoparticle formation solution).

