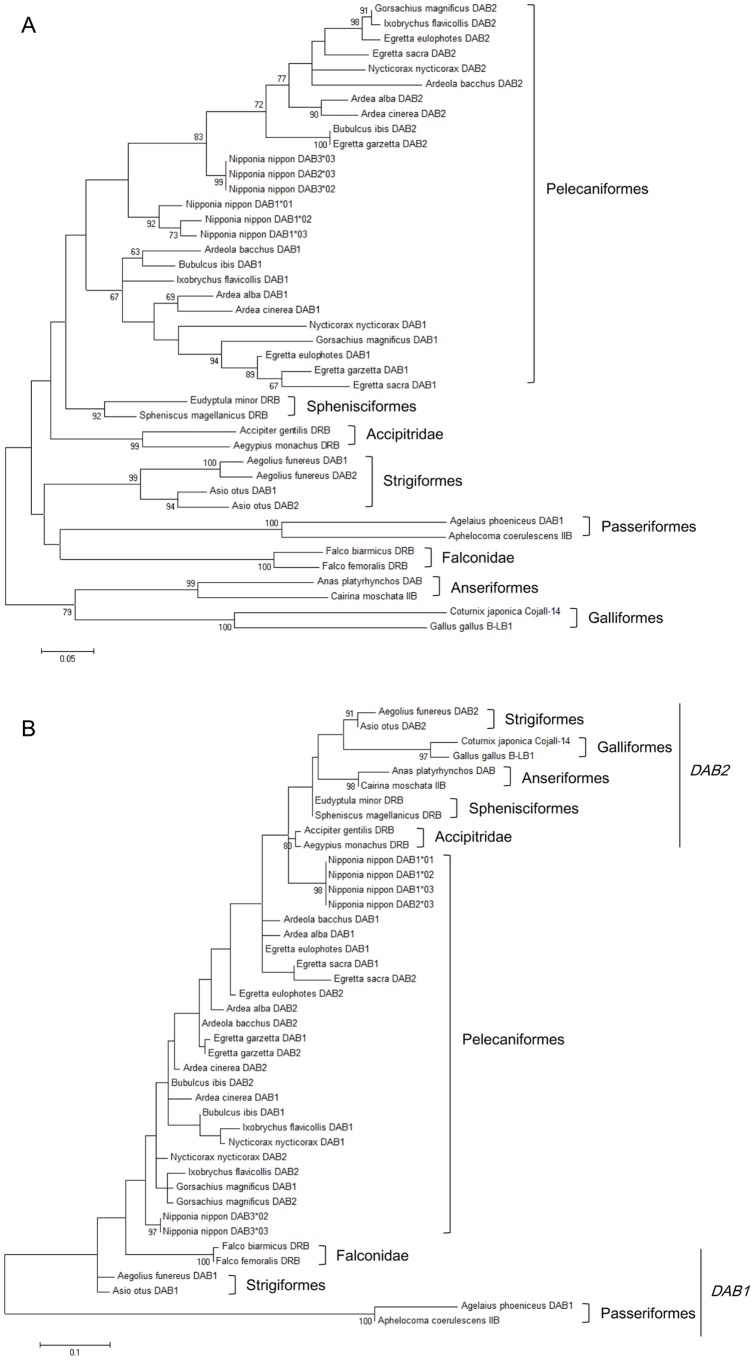
Figure 5. Maximum-likelihood tree with MHC-IIB exon 2 or partial exon 3 sequences from Nipponia nippon and other bird species.
The best-fitting nucleotide substitution model for each codon position was evaluated using Find Best DNA/Protein Models (ML) in MEGA version 5.2 [28] according to the Akaike information criterion. (A) The tree of exon 2 was constructed by using a Kimura 2-parameter model with gamma distribution in MEGA. (B) The tree of partial exon 3 was constructed by using a Tamura 3-parameter model with gamma distribution in MEGA. Bird species used for the analyses were shown in Table S3. In both analyses, bootstrap values were evaluated with 1000 replications. Bootstrap values>60 are shown in this tree. Branch lengths represent the number of changes per site.

