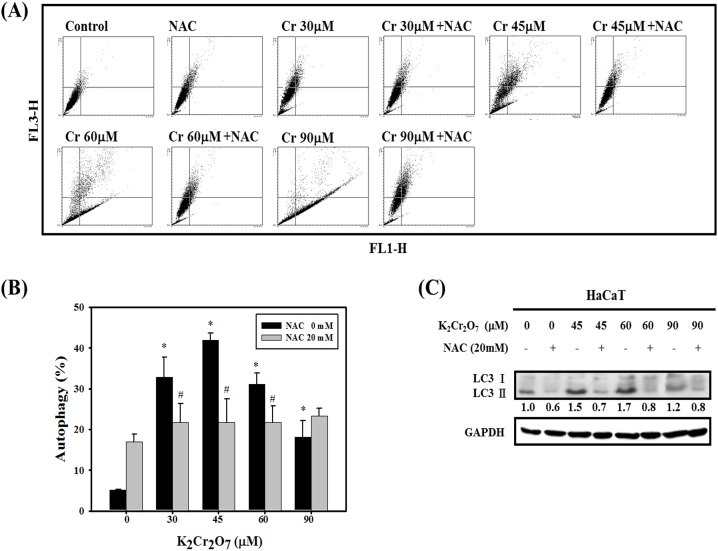
Figure 3. Effect of NAC on Cr(VI)-induced autophagy in HaCaT cells.
(A) Development of AVOs in HaCaT cells. Detection of green and red fluorescence in AO-stained cells using flow cytometry. Cells were pretreated with NAC (20 mM), cultured for 1 hr and then incubated in the presence of different concentrations of Cr(VI) for 24 hrs. (B) Quantification of AVOs in HaCaT cells. Data are presented as the mean ± SD from three independent experiments. (*Significant versus Control group; p<0.05; #Significant versus Cr(VI) -treated Group; p<0.05). (C) The expression of autophagy proteins, LC3-I and LC3-II, and GAPDH were monitored after 24 hrs of Cr(VI) or Cr(VI) plus NAC exposure in HaCaT cells. Data are presented from three independent experiments.

