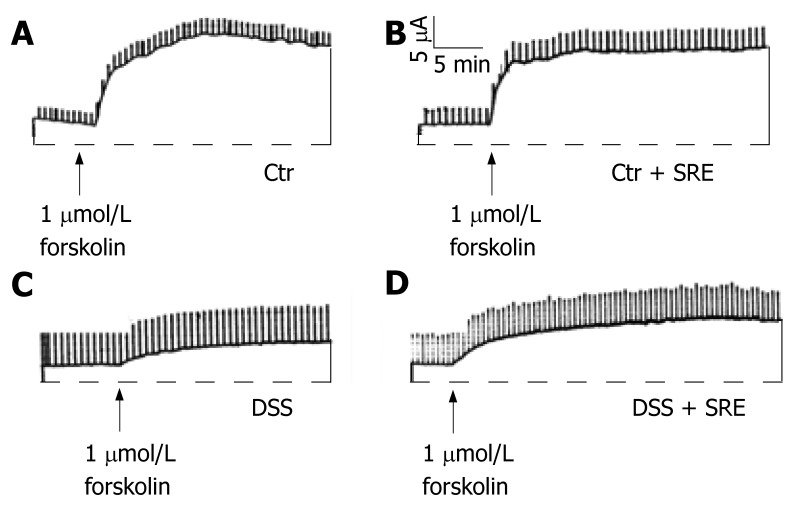
Figure 6.
Representative tracings showing the change in ISC evoked by forskolin in different groups of rat on d 7. All four groups showed an increase in ISC but with different magnitudes (A-D). The ISC response was greatly reduced in the DSS group (C) when compared with the control (A). On the other hand, the reduction in secretory response appears to be ameliorated in the DSS + SRE group (D). The transient current pulses were the results of intermittently clamping the potential at 1 mV. The horizontal lines represent zero ISC. The record is representative of at least six experiments.

