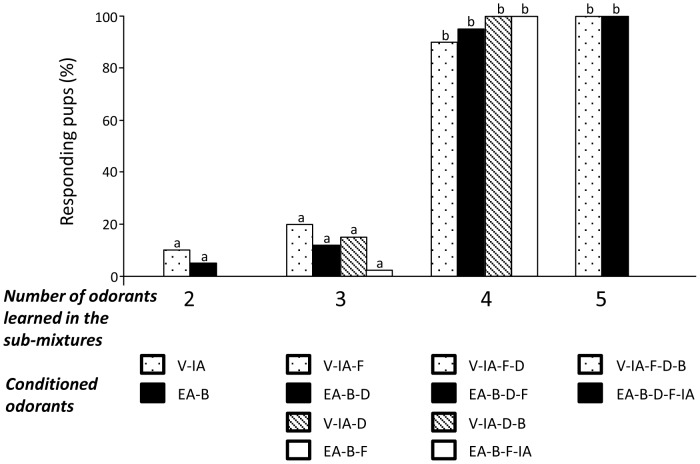
Figure 5. Proportions of 2-day-old rabbit pups responding in an oral activation test to the RC mixture after conditioning to sub-mixtures of 2, 3, 4 and 5 odorants that compose RC. Dotted bars represent the responsiveness to RC after conditioning to sub-mixtures containing the more RC-typical components, black bars with the less RC-typical components.
Hatched and white bars illustrate the pup responsiveness to RC after conditioning to other sub-mixtures of RC components. Statistical differences are indicated by the letters on top of the bars (p<0.05).

