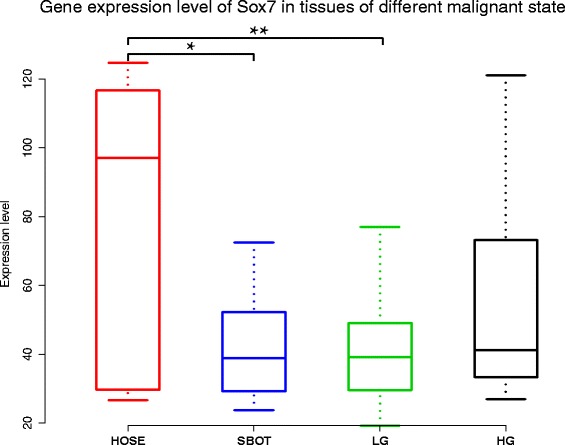
Figure 2.

One-way ANOVA analysis of SOX7 mRNA expression levels among HOSE, SBOT, LG and HG. A significant correlation was found in HOSE relative to SBOT (p = 0.033) and HOSE compared with LG (p = 0.007).

One-way ANOVA analysis of SOX7 mRNA expression levels among HOSE, SBOT, LG and HG. A significant correlation was found in HOSE relative to SBOT (p = 0.033) and HOSE compared with LG (p = 0.007).