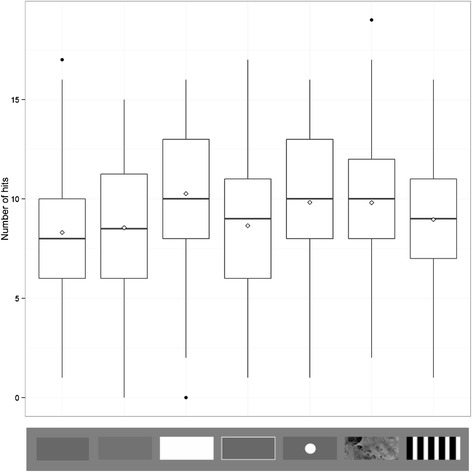
Figure 2.

Distribution of the number of hits for each target type across all subjects and trials. Trial types from left to right are average background luminance matching grey, lighter grey, white, white edged grey, ‘spot’, background matching camouflage and high contrast stripe. Whiskers encompass 1.5 × the interquartile range, and points beyond this are plotted as outliers (black circles). Means are represented by white diamonds.
