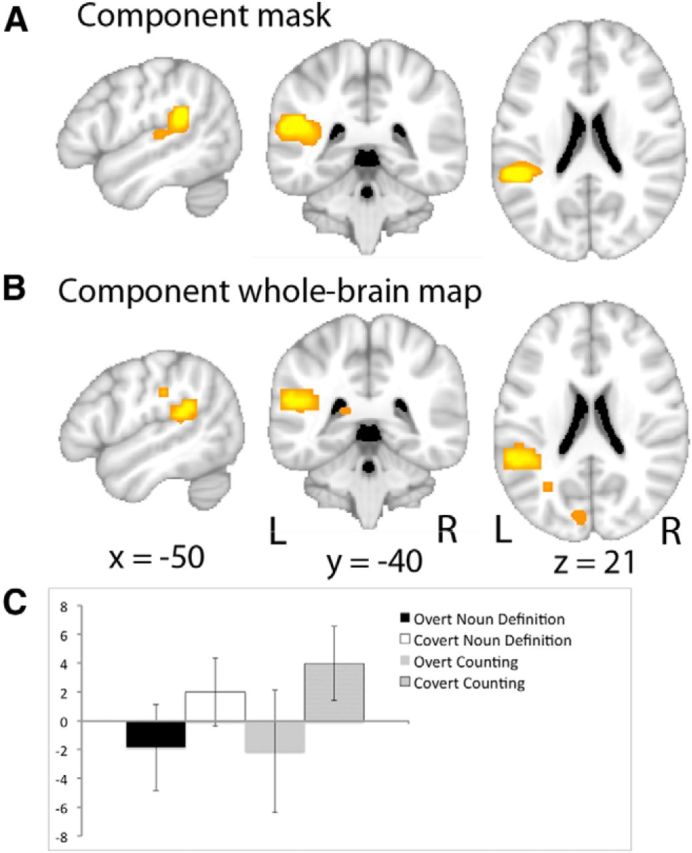
Figure 6.

ICA results. A, The “Spt-like” component identified from the PT ICA. B, The whole-brain functional connectivity map for this component. The colored overlays are displayed on sagittal (x = −50 mm, left image), coronal (y = −40 mm, center image), and axial (z = 21 mm, right image) slices taken from a standard MNI brain template. The statistical threshold for the whole-brain functional connectivity was set at p < 0.01, corrected for multiple comparisons using a correction for familywise error rate. C, Activity for this component, as identified by the ICA, in response to the different speech production tasks: Overt Noun Definition (black), Covert Noun Definition (white), Overt Counting (gray), and Covert Counting (hatched). Error bars represent 95% confidence intervals.
