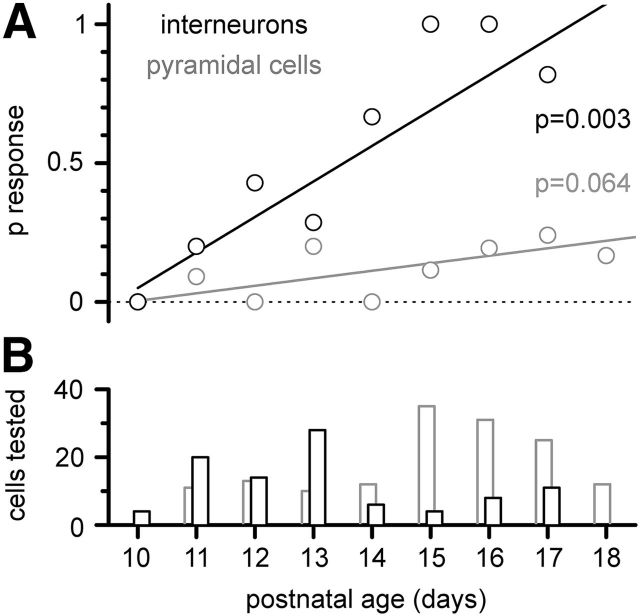
Figure 8.
Developmental profile of the probability of finding light-evoked responses in interneurons (black empty circles) versus pyramidal cells (gray empty circles). A, Summary plot of the probability of obtaining a response (p response) and linear fits, weighted according to the number of cells tested at each postnatal age. B, Bar plot of the number of interneurons/pyramidal cells (black empty bars/gray empty bars) tested to estimate the probability of obtaining a response.

