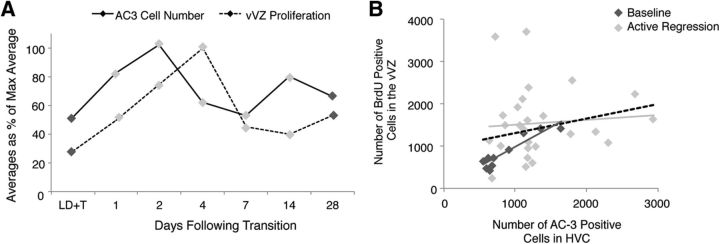
Figure 4.
The relationship between proliferation in the vVZ and the number of apoptotic cells in HVC during rapid regression of the song control system. A, The lag in time of peak vVZ proliferation compared with HVC cell death. The levels of cell death in HVC and proliferation in the vVZ are plotted relative to the maximum value of each measure to facilitate comparison of the time course of both measures. Proliferation in the vVZ peaks at 4 d following transition from breeding to nonbreeding conditions and 2–3 d following the peak of HVC cell death. B, The correlation between proliferation in the vVZ and the number of apoptotic cells in HVC during rapid regression of the song control system. All data pooled is indicated by the dashed line (R2 = 0.0464, p = 0.2140, n = 30 birds), pooled baseline condition data (i.e., 28 d of LD+T and SD; n = 9 birds) by the dark gray diamonds (individual data points) and dark gray solid line, and pooled active regression data (i.e., 1, 2, 4, 7, and 14 d of SD; n = 21 birds) by the light gray diamonds and solid line. See Table 3 for correlations between vVZ proliferation and AC-3 cell number within individual time points.

