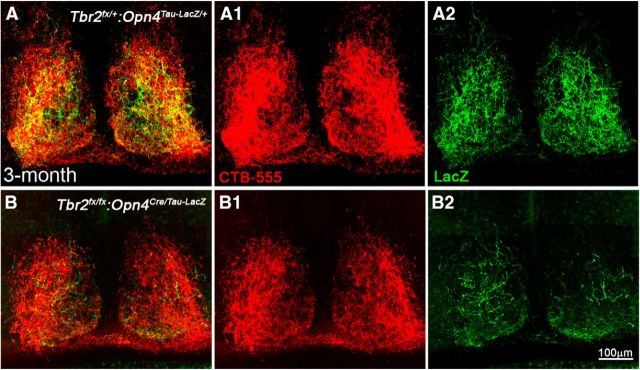
Figure 9.
Anterograde RGC axon tracing reveals more axon coverage in the SCN than reported by Opn4Tau–LacZ. A, A section of center SCN from a Tbr2flox/+:Opn4Tau–LacZ/+ control mouse that received 2 μl of CTB-555 in the right eye. A1 shows CTB-555 labeling, and A2 shows LacZ labeling. B, A section of center SCN from a Tbr2flox/flox:Opn4Cre/Tau–LacZ mutant mouse received the same CTB-555 treatment as the control. B1 shows CTB-555 labeling, and B2 shows LacZ labeling.

