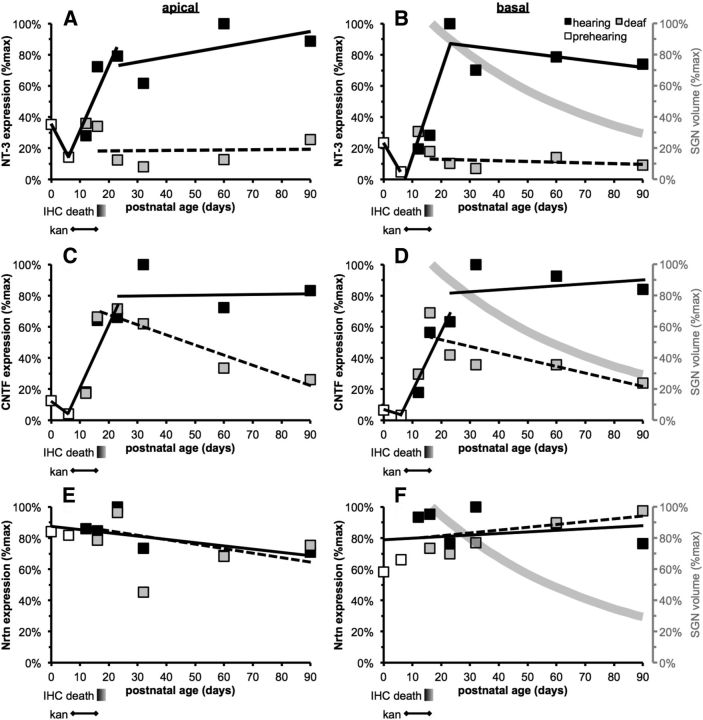
Figure 8.
Temporal expression pattern for representative NTFs. Data from Figures 6 (A–D here) and 7 (E, F here) are replotted to better show expression of NT-3 (A, B), CNTF (C, D), and neurturin (Nrtn; E, F) in hearing (filled squares) and deafened (open squares) rats, as a function of postnatal age, in the apical (A, C, E) and basal (B, D, F) halves of the OC. The horizontal axis shows postnatal age in days, to scale. Below this axis are shown the approximate period over which IHCs die in the apex and base (from Figs. 2, 3), depicted as a shaded bar, and the period over which kanamycin (kan) is administered. For illustrative purposes, expression trends over time are indicated on the graphs by heavy black lines, solid for hearing rats, and dashed for deaf rats. For control hearing rats, trends in NT-3 and CNTF expression are shown separately for three time periods: (1) immediately postnatally, expression declines, illustrated by the line from P0 to P6; (2) during hearing onset, expression increases, illustrated by a best-fit line computed by linear regression from P6 to P23; and (3) after hearing onset, expression is stable, illustrated by a best-fit line computed by linear regression from P23 to P90. For deafened rats, trends are illustrated differently for NT-3 and CNTF expression. For NT-3, the trend is illustrated by a best-fit line computed by linear regression from P12 to P90 and, for CNTF, by a line connecting P12 to P16 and a best-fit line computed by linear regression from P23 to P90. The trends in neurturin expression for hearing and deafened rats are separately illustrated by best-fit lines computed by linear regression from P23 to P90. The gray curve in B, D, and F approximates the loss of SGNs in the cochlear base over the time period of these experiments based on data published by Alam et al. (2007).

