
Figure 1.
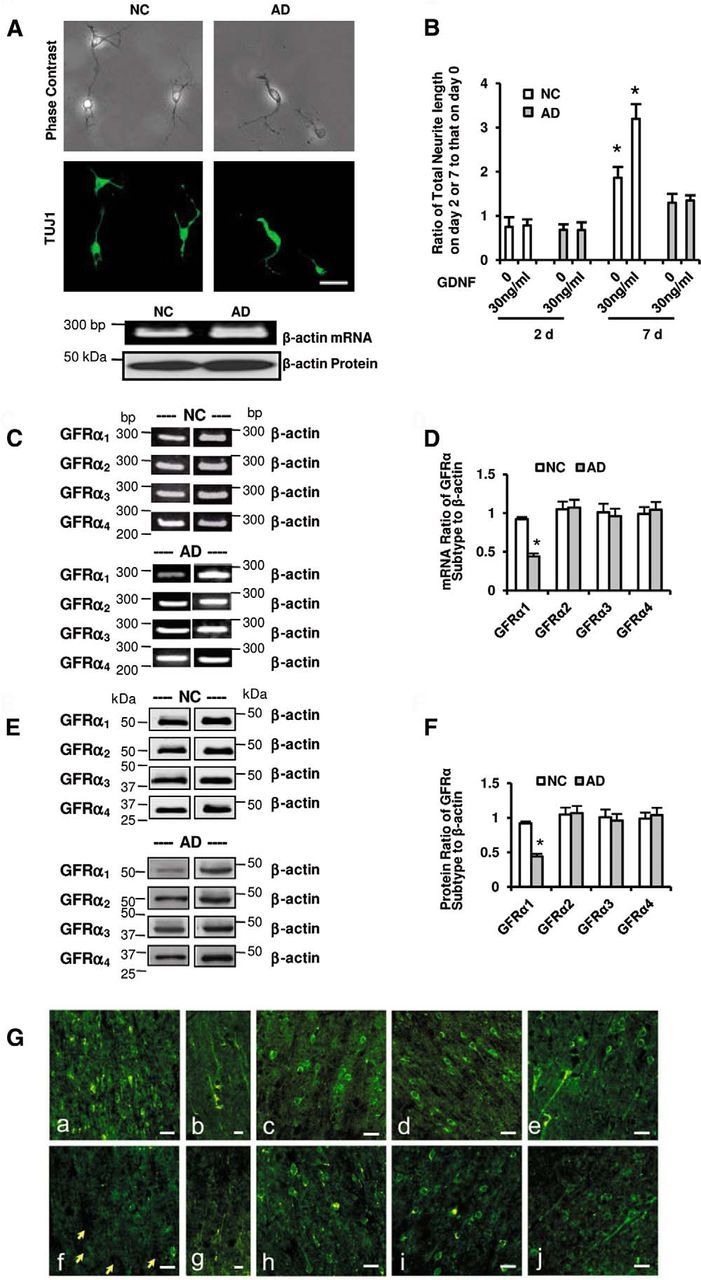
Expression of GFRα in NC and AD neurons. A, Cortical neurons isolated from NC and AD brains (NC and AD neurons) were cultured for 7 d in the presence of 30 ng/ml GDNF. Representative neurons were verified by phase contrast microscopy and TUJ1 immunostaining. Scale bar, 100 μm. The β-actin expression was not different between NC and AD neurons at both mRNA and protein levels. B, Neurite extension of NC and AD neurons was quantitatively evaluated as the ratio of total neurite length in the presence or absence of GDNF on days 2 and 7 to that on day 0. We measured the length of neurites directly from the cell base to the neurite apex, including the length of the cell soma. Data were obtained in a blinded manner from triplicate wells of six independent cultures (mean ± 1 SD; n = 6; *p < 0.05 by the Steel–Dwass test). C–F, Representative images of GFRα mRNA (C, D) and protein (E, F) expressions in NC and AD neurons are shown, and their semiquantitative RT-PCR mRNA (D) and protein (F) levels were analyzed by RT-PCR and Western blotting, respectively. The levels of GFRα mRNA and protein were normalized to the corresponding β-actin. Data were obtained in triplicate from six independent cultures (mean ± 1 SD; n = 6; *p < 0.05 by the Steel-Dwass test). Ga–j, Representative images of the immunohistochemistry of GFRα1 (a, b, f, g), GFRα2 (c, h), GFRα3 (d, i), and GFRα4 (e, j) in the temporal cortex from the NC (a–e) and AD (f–j) brain. Tissue sections were incubated with specific antibodies against GFRα1–4 (R&D Systems) before the addition of corresponding secondary biotinylated antibodies (Vector Laboratories), followed by visualization with streptavidin-Alexa Fluor 488 (Invitrogen). Yellow arrows depict unstained neurons. Scale bars: b, g, 50 μm; a, c–f, h–j, 100 μm.