Figure 3.
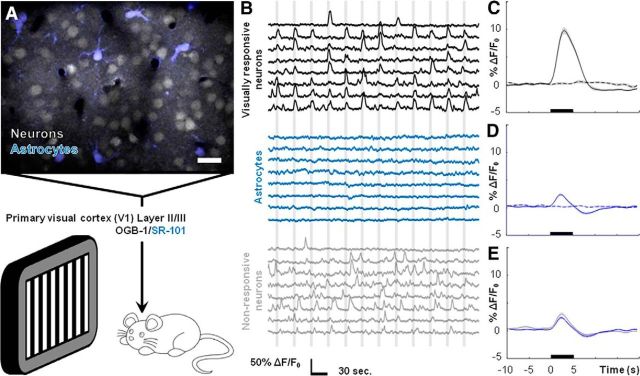
Mouse visual cortical astrocytes do not display observable somatic Ca2+ elevations following visual stimulation. A, Field image showing Layer II/III neurons and astrocytes loaded with OGB-1 (gray)/SR-101 (blue) dye. Drifting grating visual stimuli were presented to lightly sedated, responsive mice. B, Representative traces of fluorescence signals from ROIs drawn around the cell bodies of visually responsive neurons (black traces), astrocytes (blue traces), and visually nonresponsive neurons (gray traces) during stimulus presentations (vertical gray bars). C, Average neuronal Ca2+ increase to visual stimuli (n = 4 mice, 87 cells, 3132 stimulus trials). D, Average astrocytic Ca2+ dynamics during visual stimuli (n = 4 mice, 35 cells, 1152 stimulus trials). E, Average astrocytic (blue) and nonresponsive neuronal (gray, n = 4 mice, 82 cells, 3132 stimulus trials) Ca2+ dynamics during visual stimuli, indicating contamination from neuropil signal. Scale bar: A, 20 μm. For C–E, stimuli were presented during time frame indicated by black bars, dashed lines indicate no-stimulus trials, and shaded regions represent SEM.

