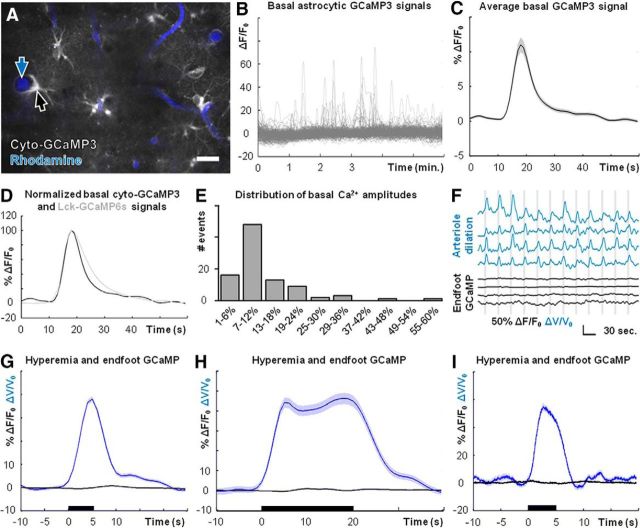
Figure 4.
Cortical arterioles dilate in the absence of observable Ca2+ elevations in perivascular astrocyte endfeet. A, Field image of cyto-GCaMP3 (gray) and intravascular rhodamine (blue), showing astrocyte endfeet (black arrow) and cortical arterioles (blue arrow). B, Nonbiased sampling of cyto-GCaMP3 using a grid analysis (see Materials and Methods) reveals robust basal astrocytic Ca2+ dynamics. C, Average basal astrocytic single-peak Ca2+ elevation detected by cyto-GCaMP3 (n = 3 mice, 94 Ca2+ signals). D, Average basal astrocytic single-peak Ca2+ elevations detected by cyto-GCaMP3 (black trace) and Lck-GCaMP6s (gray trace; Fig. 2D), normalized to respective maxima. E, Histogram of basal single-peak amplitudes detected by cyto-GCaMP3 (n = 3 mice, 94 Ca2+ signals). F, Representative simultaneous measures of blood flow changes based on arteriole dilations (blue traces) and astrocyte endfoot Ca2+ dynamics (black traces) during visual stimulation (vertical gray bars). The top three traces for each are from experiments using cyto-GCaMP3. The bottom trace is from an experiment using Lck-GCaMP6s. G, Average blood flow (blue trace, n = 9 mice, 464 stimulus trials) and astrocyte endfoot Ca2+ (black trace, n = 9 mice, 464 stimulus trials, pooled from cyto-GCaMP3 and Lck-GCaMP6s experiments) dynamics following 5-s-long visual stimuli (black bar). H, Average blood flow (blue trace; n = 5 mice, 187 stimulus trials) and astrocyte endfoot Ca2+ (black trace; n = 5 mice, 187 stimulus trials, pooled from cyto-GCaMP3 and Lck-GCaMP6s experiments) dynamics following 20-s-long visual stimuli (black bar). I, Average blood flow (blue trace) and astrocyte endfoot Ca2+ (black trace, Lck-GCaMP6s) dynamics assessed by high-speed multiphoton line scanning (n = 3 mice, 183 stimulus trials) following 5-s-long visual stimuli (black bar). Scale bar: A, 20 μm. Shaded regions in C, G–I represent SEM.

