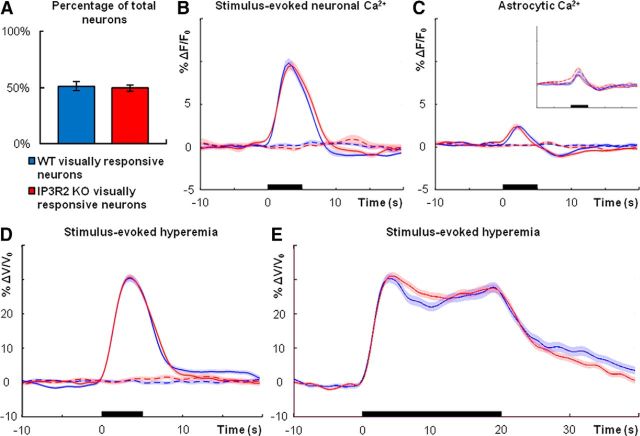
Figure 6.
Neurovascular coupling is intact in visual cortex of lightly sedated, responsive IP3R2 KO mice. A, Percentage of neurons (OGB-1 positive/SR-101 negative) that are responsive to visual stimuli (n = 4 mice each genotype; wild type, n = 169 total cells; KO, n = 177 total cells; Student's t test, p = 0.7328). B, Average neuronal Ca2+ increases in wild type (blue; n = 4 mice, 87 cells, 3132 stimulus trials) and IP3R2 KO (red; n = 4 mice, 88 cells, 3168 stimulus trials) following 5-s-long visual stimulation (black bar). Dashed traces are averages from trials in which no stimuli were presented. C, Average astrocytic Ca2+ dynamics following 5-s-long visual stimulation (black bar) in wild type (blue; n = 4 mice, 35 cells, 1152 stimulus trials) and IP3R2 KO (red; n = 4 mice, 30 cells, 1080 stimulus trials). Dashed traces are averages from trials in which no stimuli were presented. Inset additionally displays wild-type (dashed blue trace) and IP3R2 KO (dashed red trace) nonresponsive neuron Ca2+ signals during visual stimuli, indicating contamination from neuropil signal. D, Average blood flow increase following 5-s-long visual stimulus (black bar) in wild type (blue; n = 7 mice, 379 stimulus trials) and IP3R2 KO (red; n = 8 mice, 414 stimulus trials). Dashed traces are averages from trials in which no stimuli were presented. E, Average blood flow increase to 20-s-long visual stimulus (black bar) in wild type (blue; n = 7 mice, 189 stimulus trials) and IP3R2 KO (red; n = 6 mice, 227 stimulus trials). Dashed traces are averages from trials in which no stimuli were presented. Error bars in A and shaded regions in B–E represent SEM.

