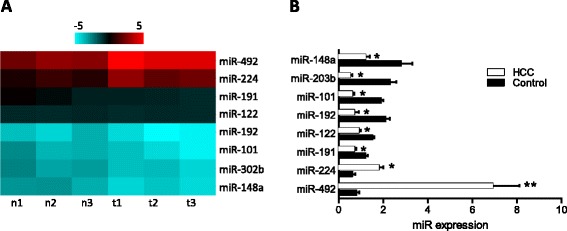
Figure 1.

Comparison of miRNA expression profile between HCC tissues and adjacent non-cancerous tissues using an array-based miRNA profiling. (A) The heat map diagram shows the result of the differentially expressed miRNAs (only differentially expressed miRNAs with fold change > =1.5 or fold change = <0.8 and p value <0.05 are included) from miRNA microarray. (B) The expression levels of these miRNAs were measured by qRT-PCR and normalized to the expression of U6 in each sample. Data are the mean ± SD (n = 3) of one representative experiment. Similar results were obtained in three independent experiments. n: adjacent non-cancerous tissues, t: HCC tissues. *refers to p < 0.05 and **refers to p < 0.01 in a Student’s t test between the HCC group and the control group.
