Figure 5.

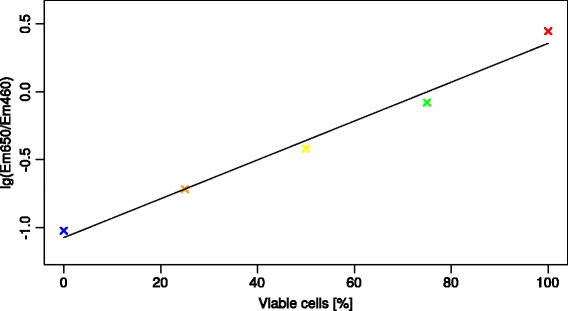
Logarithm basis 10 of the Em 650 /Em 460 quotient values plotted over the percentage of viable cells and a linear regression of the data points.

Logarithm basis 10 of the Em 650 /Em 460 quotient values plotted over the percentage of viable cells and a linear regression of the data points.