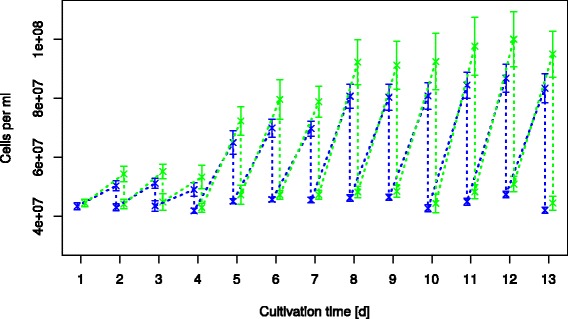
Figure 7.

Cultivation over 13 days with daily dilutions back to the starting OD of 0.4. The cell count at the various wells (edge of the plate (green) & middle wells (blue)) are shown over the cultivation time. Light intensity was varied during the cultivation time [photon flux in μmol m-2 s-1]: Day 1-3: 15; Day 4-7: 32; Day 8-10: 51; Day 11-13: 72.
