
Figure 10.
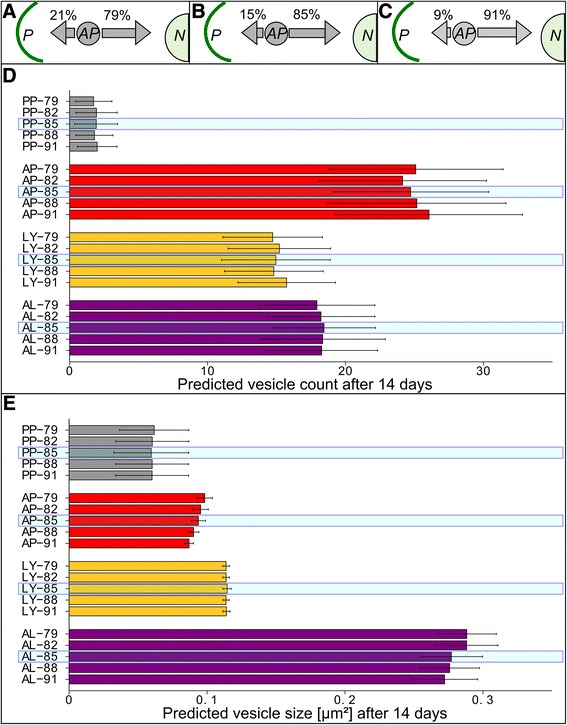
Impact of minor changes to autophagosome movements in long-term simulations of optimized integrative model. A-C Schematic describing bi-directional movement of autophagosomes (AP) between the cell periphery (P) and nucleus (N). Arrows denote probabilities for AP agent movements. D-E 100 Simulations corresponding to 14 days (20160 min) were performed, using indicated altered transport probabilities. Steady-state vesicle dynamics at 14 days are reported. D Mean vesicle count with standard deviation. E Mean vesicle size with standard deviation. Numbers on the y-axis represent the probability of autophagosome movement towards the nucleus, centered on the standard value of 85% (indicated by the blue shaded box).