
Figure 2.
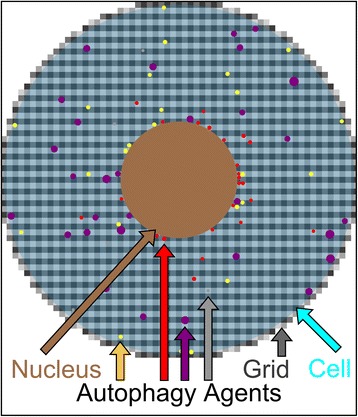
Implementation of the core model of autophagy. Schematic overview of the modeled cell as a cyan circle with a 30 μm diameter, including the nucleus with a 10 μm diameter, shown in brown. The implemented 0.5 μm × 0.5 μm grid is represented by the grey squares in the background. The four autophagic agent types are color-coded as follows; phagophores in grey, autophagosomes in red, lysosomes in yellow and autolysosomes in purple.