
Figure 6.
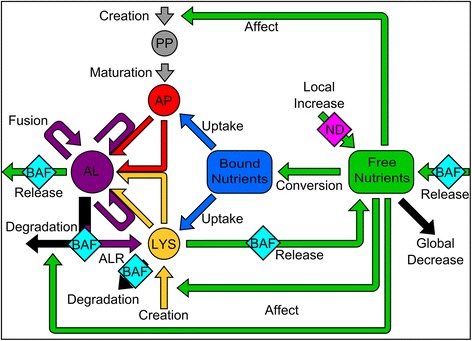
Overview of the integrative model of autophagy. Schematic describing interactions of the four agent types from Figure 1, expanded by the addition of nutrients. Each agent is color-coded; phagophores (PP) in grey, autophagosomes (AP) in red, lysosomes (LYS) in yellow and autolysosomes (AL) in purple. Two distinct nutrient-type global values are included: bound nutrients (blue) and free nutrients (green). Merging arrows represent fusion events between the two agents to form or expand an autolysosome. Black arrows represent degradation events. Arrows marked with BAF or ND indicates that this pathway is influenced under conditions with BAF or by ND. Black arrows represent degradation events.