
Figure 8.
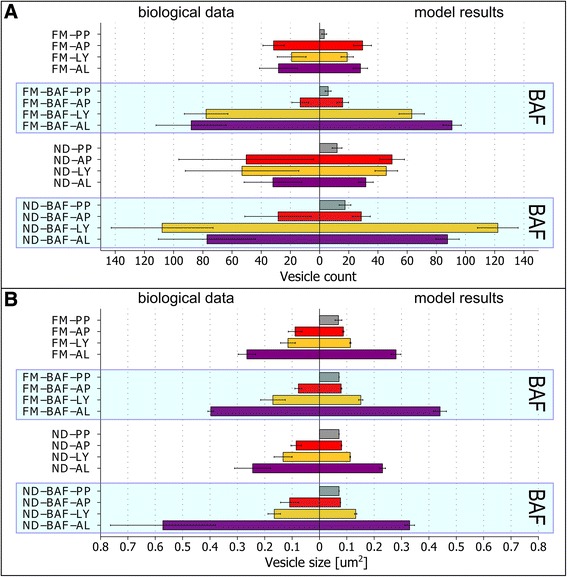
Comparison of optimized integrative model simulation results to biological measurements. The integrative model was simulated under indicated conditions for 3 hours, and results for the time point of 180 minutes are shown. The left side corresponds to biological measurements from Figure 3, and the right side indicates simulation results. A Mean vesicle count with standard deviation for the four different conditions. B Mean vesicle size with standard deviation for the four different conditions. The blue shaded box indicates conditions in the presence of BAF.