
Figure 1.
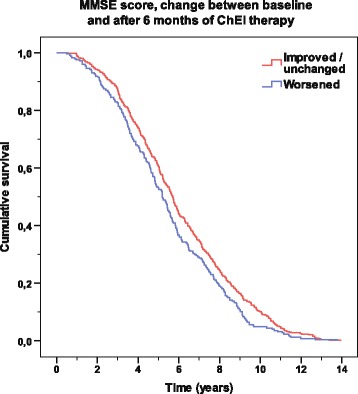
Time to death according to response in MMSE score. Kaplan–Meier graph of the distribution of time from the start of cholinesterase inhibitor treatment to death for the variable “improved/unchanged (≥0 point change) vs deteriorated (<0 point change)” based on the Mini-Mental State Examination (MMSE) score after 6 months. A log-rank test showed a significant difference between the two groups (P = 0.013).