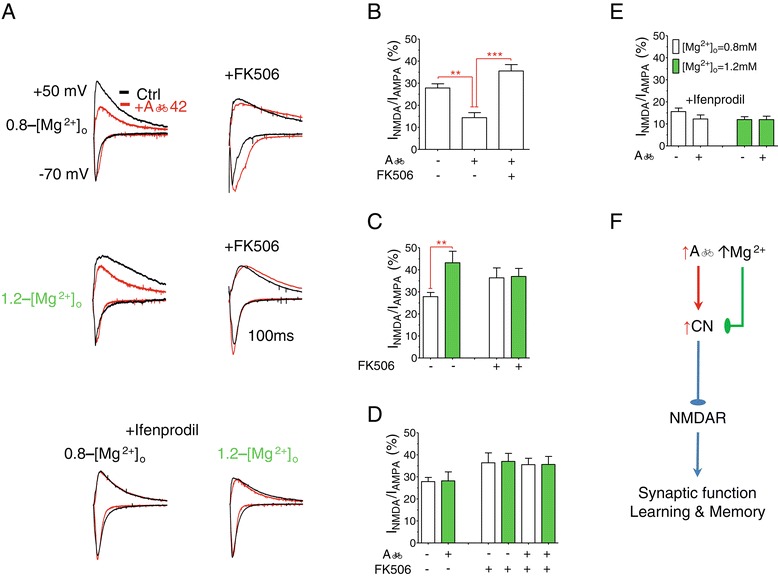
Figure 4.

Prevention of exogenous Aβ 42-induced downregulation of synaptic NMDARs by elevation of [Mg 2+ ] o . (A) Top panel: Representative traces of EPSCs recorded at membrane potentials of −70 and +50 mV at 0.8 mM [Mg2+]o (0.8-[Mg2+]o) before (black) and after (red) application of Aβ42 with (right) or without (left) the addition of calcineurin inhibitor (FK506). Middle panel: Same as above but at 1.2 mM [Mg2+]o (1.2-[Mg2+]o). Lower panel: EPSCs at 0.8 and 1.2 mM [Mg2+]o with and without Aβ42 monomers in the presence of NR2B blocker (ifenprodil). (B) The ratio of amplitudes of EPSCNMDAR to EPSCAMPA (INMDA/AMPA) in 0.8-[Mg2+]o (n = 8), 0.8-[Mg2+]o + Aβ42 (n = 7) and 0.8-[Mg2+]o + Aβ42 + FK506 (n = 8) slices. ANOVA revealed significant difference among the groups (p < 0.0001). ANOVA was followed by Bonferroni’s post hoc test. ** p < 0.01, ***p < 0.001. (C) The ratio of amplitudes of EPSCNMDAR to EPSCAMPA (INMDA/AMPA) in 0.8-[Mg2+]o (n = 8), 1.2-[Mg2+]o (green, n = 6), 0.8-[Mg2+]o + FK506 (n = 7) and 1.2-[Mg2+]o + FK506 slices (n = 7). (D) The ratio of amplitudes of EPSCNMDAR to EPSCAMPA (INMDA/AMPA) in 0.8-[Mg2+]o (n = 8), 1.2-[Mg2+]o + Aβ42 (n = 6), 0.8-[Mg2+]o + FK506 (n = 7) and 1.2-[Mg2+]o + FK506 slices (n = 7), 0.8-[Mg2+]o + Aβ42 + FK506 (n = 8) and 1.2-[Mg2+]o + Aβ42 + FK506 (n = 8). (E) The ratio of amplitudes of EPSCNMDAR to EPSCAMPA (INMDA/AMPA) after the addition of ifenprodil; 0.8-[Mg2+]o (n = 6), 0.8-[Mg2+]o + Aβ42 (n = 10), 1.2-[Mg2+]o (n = 8) and 1.2-[Mg2+]o + Aβ42 (n = 12). Recordings were conducted, in vitro, using acute hippocampal slices from 4 weeks old WT mice. Unpaired t-tests, ** p < 0.01. Error bars show SEM. (F) Schematic illustration of how high Aβ impairs NMDARs and how elevation of [Mg2+]o might prevent this impairment.
