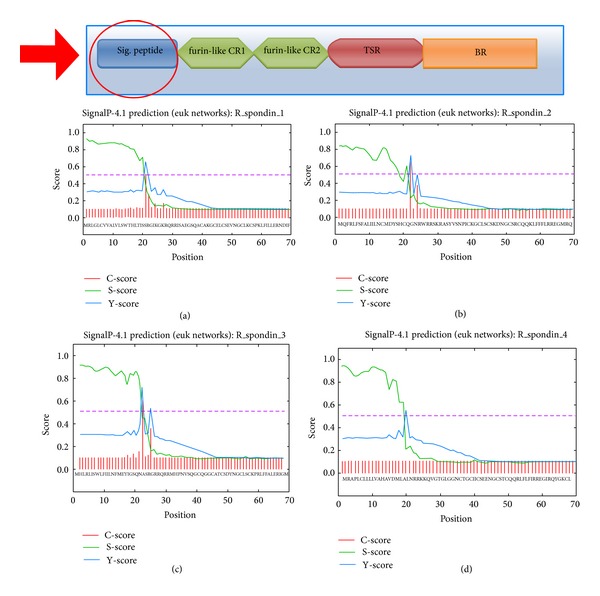
Figure 3.

Predicted architecture of signal peptide of different human (Rspo)s with “C-score,” “S-score,” and “Y-score” (C-score represents predicted cleavage site value; S-score represents the predicted signal peptide value; Y-score represents a combination of C- and S-scores). (a) Rspo1, (b) Rspo2, (c) Rspo3, and (d) Rspo4 (the schematic diagram shows the location of signal peptide in the general domain architecture of human (Rspo)s and our region of analysis).
