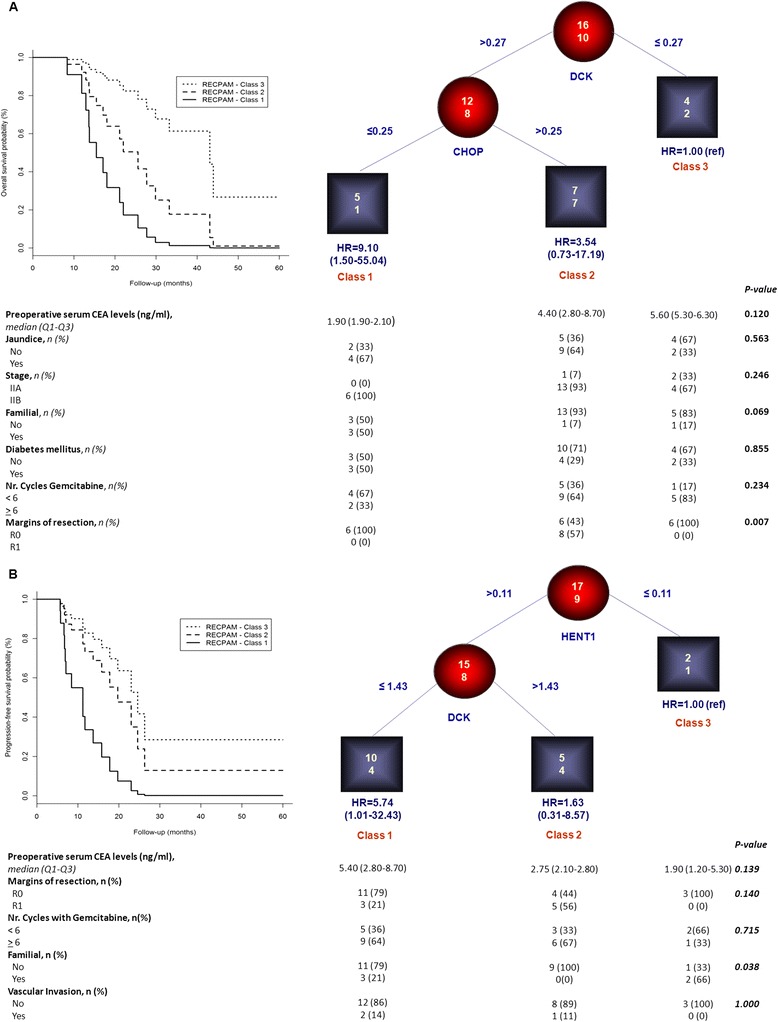
Figure 2.

Identification of subgroups at different risks based on gene-expression interactions: results of RECPAM analysis. A: Classes of patients with different mortality risks; B: Classes of patients with different disease progression risks. Chosen splitting variables are shown between branches, while condition sending patients to left or right sibling is on relative branch. Circles indicate subgroups of patients. Squares indicate RECPAM classes. Numbers inside circles and squares represent the number of events (top) and the number of non-events (bottom), respectively. The table placed at the bottom of the figures A-B shows patients’ characteristics within each RECPAM class. Plot of survival curves, estimated from Cox proportional-hazards models, with respect to each identified RECPAM class for overall survival (panel A) and progression-free survival (panel B).
