
Figure 2.
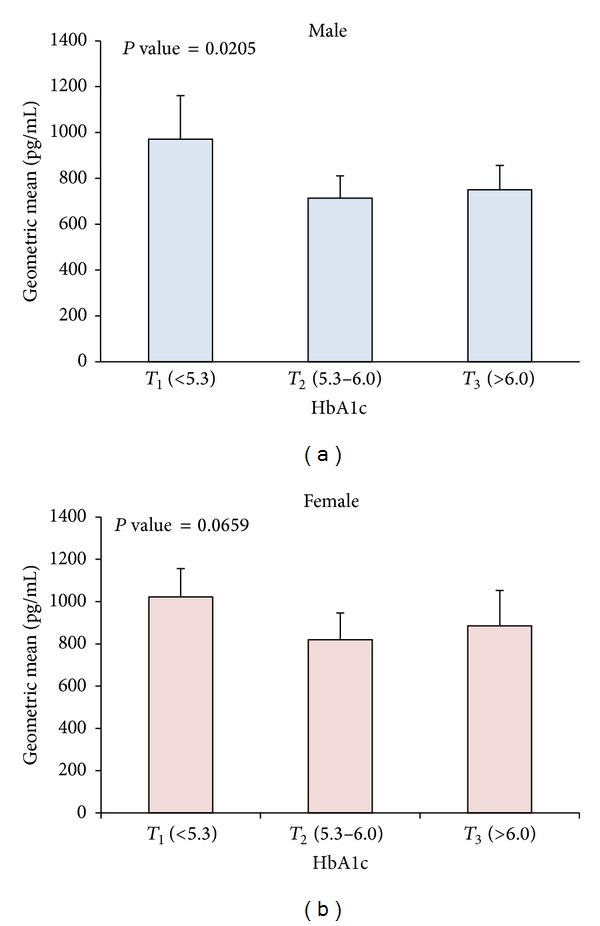
Age and BMI adjusted geometric means of ghrelin level and their effect on HbA1C. (a) Age and BMI adjusted ghrelin levels according to tertiles of HbA1C (T 1 < 5.3, 5.3 ≤ T 2 ≤ 6.0, and T 3 > 6.0) showing association between decreasing level of HbA1C and decreasing ghrelin level in males (P-trend = 0.0205). (b) Age and BMI adjusted ghrelin levels according to tertiles of HbA1C showing weak but not significant decrease in HbA1C as ghrelin level decreases in females (P-trend = 0.0659).