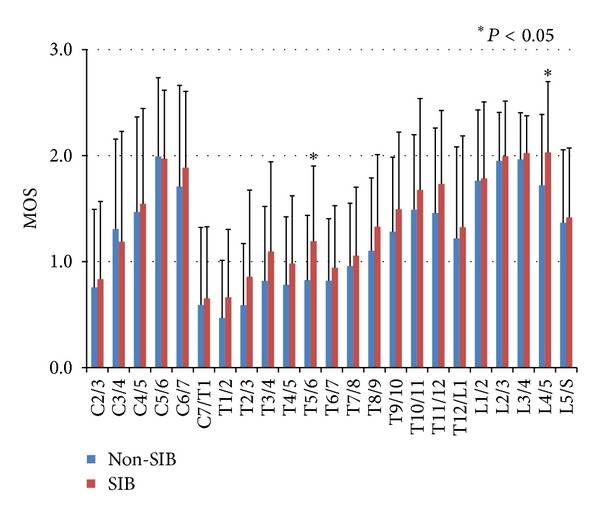
Figure 6.

The averages and standard deviations of marginal osteophyte scores (MOS) on the intervertebral levels in 22 skeletons from SIB group (red) and 48 skeletons from Non-SIB group (blue). The bars indicate the standard deviations (S.D.). There was a significant difference between the two groups in only T5/6 level and L4/5 level, and the scores in the thoracic spines were consecutively higher in the SIB group than in the Non-SIB group.
