Figure 8.

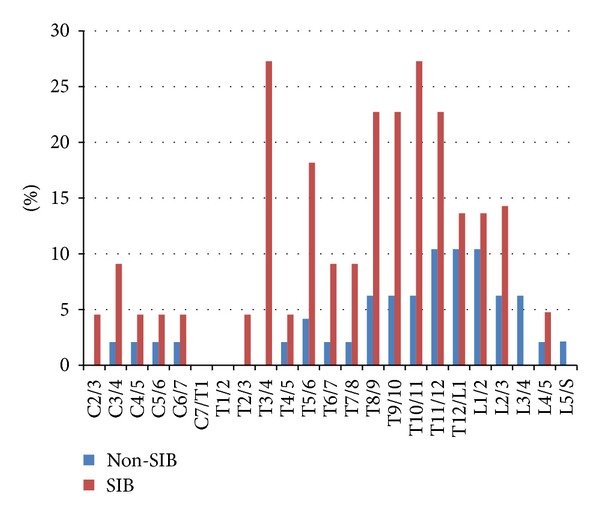
Percentage values of fused individuals in respective intervertebral spaces: Non-SIB group (blue) and SIB group (red). These values were obviously larger in the SIB group.

Percentage values of fused individuals in respective intervertebral spaces: Non-SIB group (blue) and SIB group (red). These values were obviously larger in the SIB group.