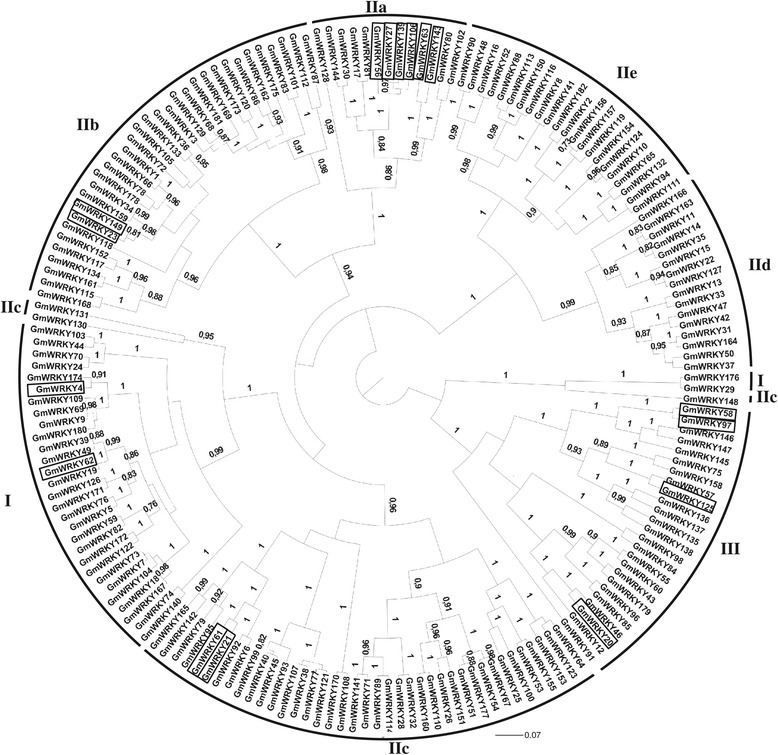
Figure 1.

Dendogram representing the relationship among the soybean WRKY proteins. The tree was reconstructed using a Bayesian (BA) method. A total of 182 amino acid sequences from G. max and 65 sites corresponding to WRKY domain were included in the analysis. The posteriori probability values are labeled above the branches and only values higher than 70% are presented. The groups I, IIa, IIb, IIc, IId, IIe and III are indicated. Differentially expressed genes in response to P. pachyrhizi infection are boxed in black.
