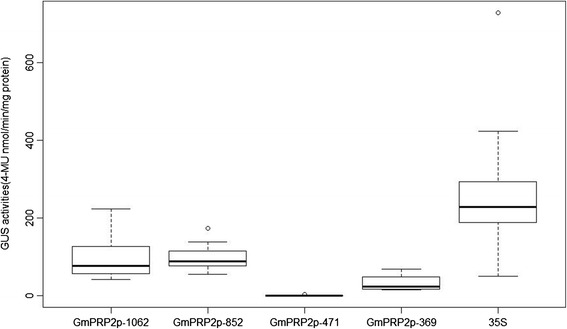
Figure 8.

GUS activity of transgenic soybean hairy roots with different constructs (GmPRP2p-1062, GmPRP2p-852, GmPRP2p-471, GmPRP2p-369, 35S). Box plot analysis of GUS activities obtained in transgenic soybean hairy roots with different constructs (GmPRP2-1062, GmPRP2-852, GmPRP2-471, GmPRP2-369, 35S). GUS activity is given in nmol 4-MU min−1 mg−1 total protein. The lower boundary of each box denotes the 25th percentile for each promoter, the solid line within each box denotes the 50th percentile, the upper boundary of each box denotes the 75th percentile. Two ends of the vertical line denote the maximum and minimum. Outlying data are indicated by empty black circles.
