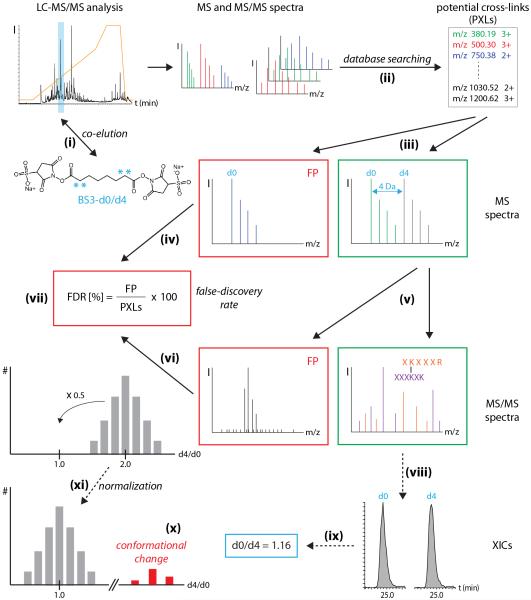
Figure 4. Data analysis workflow.
BS3-d0 and BS3-d4 cross-linked peptides co-elute during LC-MS/MS analysis (i). MS and MS/MS spectra are submitted to database searching (ii) yielding a list of potential cross-links (PXLs). MS spectra are inspected for specific peak pairs corresponding to BS3-d0 and BS3-d4 cross-linked peptides (iii). Spectra without peak pairs are rejected from further analysis (false positives, FP) (iv). MS/MS spectral quality of precursors with specific peak pair is checked (v) and spectra of poor quality are rejected (false positives, FP) (vi). The false discovery rate is calculated from the number of false positives (FP) and the total number of potential cross-linked peptides (PXLs) (vii). For comparative cross-linking XICs are generated for both the light (d0) and heavy (d4) cross-linked peptides (viii). d0/d4 cross-linking ratios are calculated (ix). Protein-protein interactions that change upon stimulation of the protein complex show d0:d4 fractions that are < or > 1:1. (x). If the majority of d0:d4 ratios deviate from 1:1, normalization of the dataset can be performed (xi).

