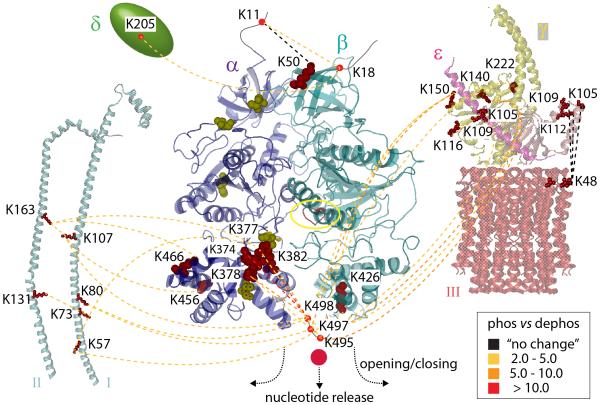
Figure 7. Summary of comparative cross-linking of phosphorylated and dephosphorylated cATPase.
Interactions within the untreated (phosphorylated, phos) and dephosphorylated (dephos) cATPase are represented with dotted lines. Changes in cross-linking intensities are colour-coded according to the legend. Phosphosites are shown space filled (yellow), cross-linked residues (red) and the nucleotide binding site (red, yellow circle). Interactions between the α/β head and I, II, γ, δ, and the extended helix of ε are reduced after dephosphorylation. Interactions between ε and the membrane ring (III) are not affected. Interactions on top of the α/β head did not change or showed only small changes. Interactions at the base were dramatically reduced inducing nucleotide release.

